2024 Water-Use Efficiency Report

2024 Water Use Efficiency (WUE) Goals—Group ‘A’ Companywide Progress Report

Total Number of Systems Washington Water Owns and Manages

219 Group ‘A’ & ‘B’, Owned and Managed

Systems Evaluated for WUE

  • 125 Total Group ‘A’ Owned
  • 77 NW District Group ‘A’ Owned
  • 48 EP District Group ‘A’ Owned

* In 2022, WWS redefined Operating Districts for geographical efficiencies.

Goal Achievement Priorities

  1. Prioritize and fix systems with DSL over 10%
  2. Prioritize and fix systems with Source of Supply Demand in excess of 0.40 AF/ERU
  3. Prioritize and fix systems with Customer Demand in excess of 0.36 AF/ERU
  4. After companywide goals have been achieved, set system specific WUE goals.

Definitions

Group ‘A’: 15 or more connections or 25 or more population count.
AF: Acre-Feet
ERU: Typical residential connection

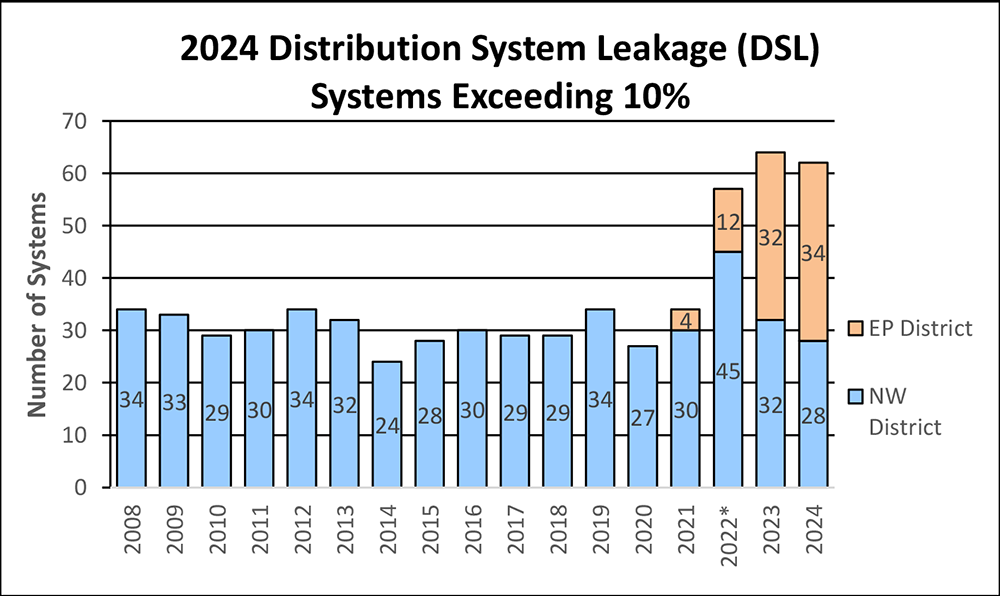
Graph showing 2024 Distribution System Leakage (DSL) Systems Exceeding 10%. In 2008, the NW District has 34 systems. In 2009, NW has 33. In 2010, NW has 29. In 2011, NW has 30. In 2012, NW has 34. In 2013, NW has 32. In 2014, NW has 24. In 2015, NW has 28. In 2016, NW has 30. In 2017, NW has 29. In 2018, NW has 29. In 2019, NW has 34. In 2020, NW has 27. In 2021, NW has 30, and the EP District has 4. In 2022, NW has 45 and EP has 12. In 2023, NW has 32 and EP has 32. In 2024, NW has 28 and EP has 34.
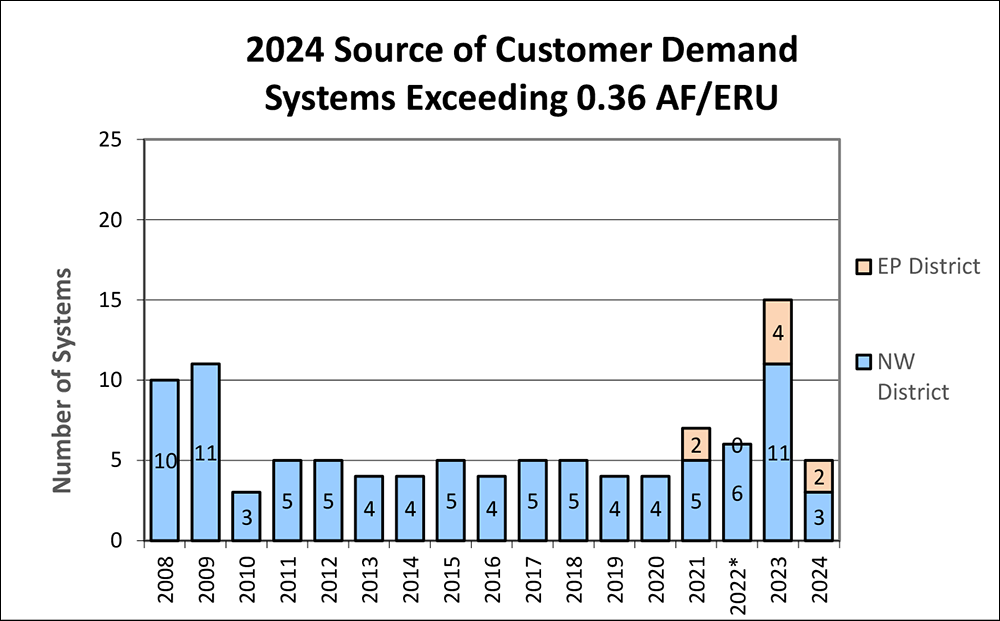
Graph showing 2024 Source of Customer Demand Systems Exceeding 0.36 AF/ERU. In 2008, the NW District has 10 systems. In 2009, NW has 11. In 2010, NW has 3. In 2011, NW has 5. In 2012, NW has 5. In 2013, NW has 4. In 2014, NW has 4. In 2015, NW has 5. In 2016, NW has 4. In 2017, NW has 5. In 2018, NW has 5. In 2019, NW has 4. In 2020, NW has 4. In 2021, NW has 5 and the EP District has 2. In 2022, NW has 6 and EP has 0. In 2023, NW has 11 and EP has 4. In 2024, NW has 3 and EP has 2.
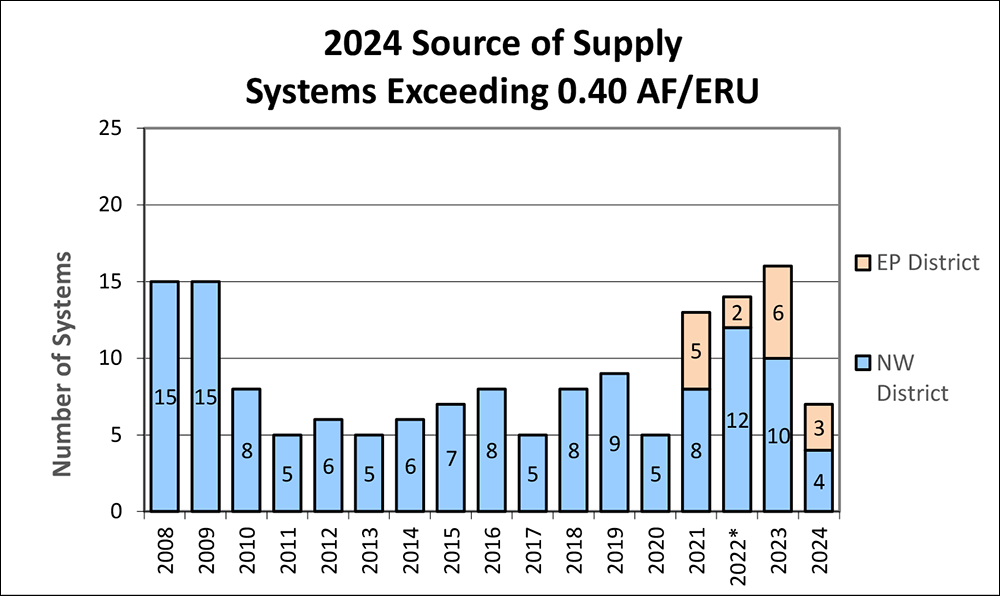
Graph showing 2024 Source of Supply Systems Exceeding 0.40 AF/ERU. In 2008, the NW District has 15 systems. In 2009, NW has 15. In 2010, NW has 8. In 2011, NW has 5. In 2012, NW has 6. In 2013, NW has 5. In 2014, NW has 6. In 2015, NW has 7. In 2016, NW has 8. In 2017, NW has 5. In 2018, NW has 8. In 2019, NW has 9. In 2020, NW has 5. In 2021, NW has 8 and the EP District has 5. In 2022, NW has 12 and EP has 2. In 2023, NW has 10 and EP has 6. In 2024, NW has 4 and EP has 3.

A printable version of this report (PDF) is also available.